Figure 5.
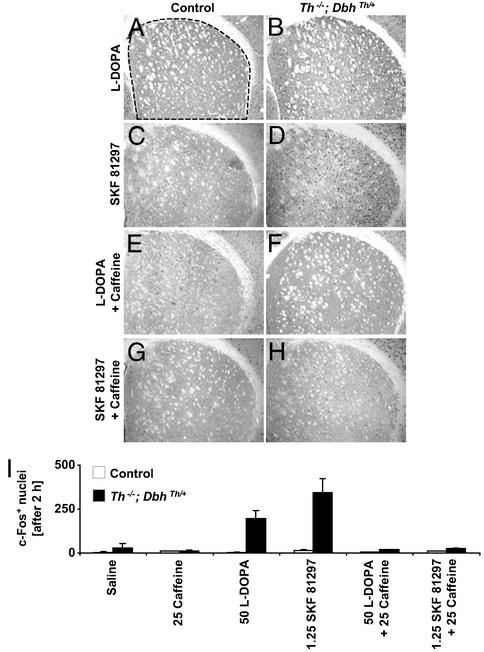
Induction of c-Fos immunoreactivity in the striatum after 2 h. (A, C, E, and G) Representative control coronal sections showing the dorsal caudate putamen (top, dorsal; right, lateral). (B, D, F, and H) Representative Th−/−; DbhTh/+ sections. (A and B) Sections after l-dopa (50 mg/kg) treatment. (C and D) Sections after SKF 81297 (1.25 mg/kg) treatment. (E and F) Sections after l-dopa (50 mg/kg) treatment + caffeine (25 mg/kg) treatment. (G and H) Sections after SKF 81297 (1.25 mg/kg) treatment + caffeine (25 mg/kg) treatment. (I) c-Fos-positive nuclei in dorsal CPu (mean ± range). Control mice, white bars (n = 2 mice, three images per mouse); Th−/−; DbhTh/+ mice, black bars (n = 2 mice, three images per mouse). Dashed line indicates region where nuclei were counted. Numbers indicate dose of drug (mg/kg body weight).

