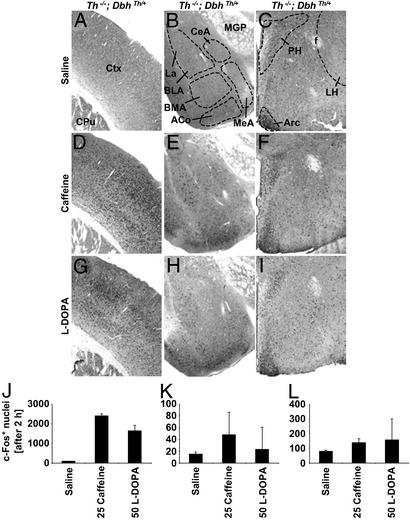
Figure 6.
c-Fos expression in the cortex, amygdala, and hypothalamus of Th−/−; DbhTh/+ mice after 2 h. (A, D, and G) Representative coronal sections showing the cortex (top, dorsal; right, lateral). (B, E, and H) Representative coronal sections showing the amygdala (top, dorsal; right, medial; La, lateral amygdala; BLA, basolateral amygdala; BMA, basomedial amygdala, ACo, cortical amygdaloid nucleus; CeA, central amygdala; MeA, medial amygdala; MGP, medial globus pallidus). (C, F, and I) Representative coronal sections showing the hypothalamus (top, dorsal; right, lateral; PH, paraventricular hypothalamic nucleus; Arc, arcuate; LH, lateral hypothalamus, f, fornix). (A–C) Sections after 0.9% saline treatment. (D–F) Sections after caffeine (25 mg/kg) treatment. (G–I) Sections after l-dopa (50 mg/kg) treatment. (J–L) Number of c-Fos-positive nuclei in cortex, amygdala, and hypothalamus, respectively (mean ± range; n = 2 mice, three images per mouse). Numbers indicate dose of drug (mg/kg body weight).

