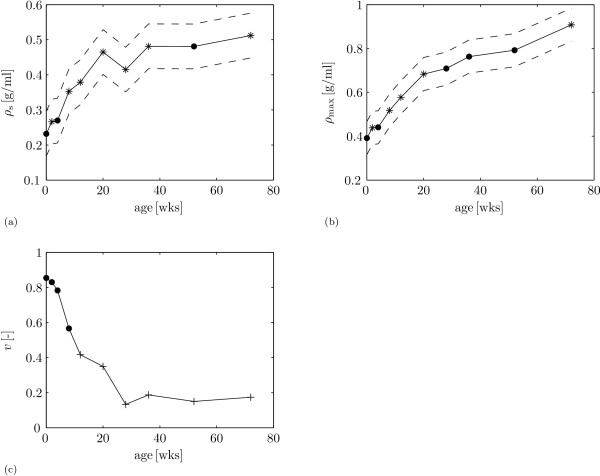
Figure 5.
Statistical results for collagen densities. Statistical results for collagen density profiles. With (a) mean collagen density at the surface ρs (solid) ± standard deviation (dashed) as a function of age. Stars mark values that are significantly different from the value at the previous age; (b) mean maximum collagen density ρmax (solid) ± standard deviation (dashed) as a function of age. Stars mark values that are significantly different from the value at the previous age; and (c) mean scores for the presence of the collagen density valley ν as a function of age. Crosses mark values that are significantly different from the value at 0 weeks.

