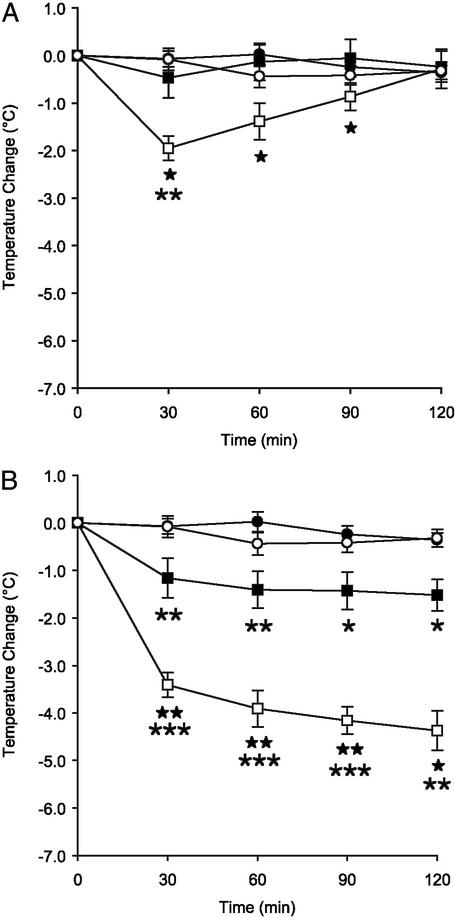
Figure 3.
Effects of 5-CT on body temperature. Time course of hypothermia following an i.p. injection of 5-CT (0.5 mg/kg, A; or 3 mg/kg, B) or vehicle in 5-HT7+/+ or 5-HT7−/− mice. The symbols represent 5-HT7+/+ vehicle (○), 5-HT7−/− vehicle (●), 5-HT7+/+ 5-CT (□), and 5-HT7−/− 5-CT (■), respectively. *, P < 0.05; **, P < 0.01; ***, P < 0.001 for 5-CT-treated vs. vehicle-treated in the same genotype. ★, P < 0.05; ★★, P < 0.01 for 5-HT7+/+ vs. 5-HT7−/− mice treated with 5-CT. Data represent mean ± SEM, n = 6 mice per group.

