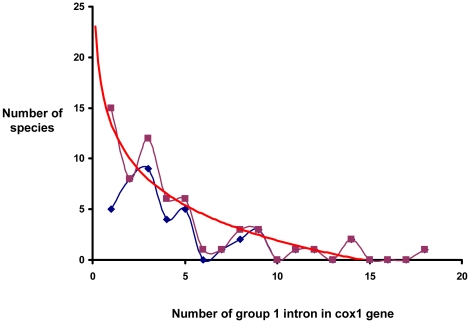
Figure 5. Graphical representation of number of eukaryotic species (purple curve) and fungal species (blue curve) as a function of number of introns carried by their cox1 gene.
The red curve shows the logarithmic regression model (y = −5,0316Ln(x) +13,507; R2 = 0.83) with all the eukaryotic species analyzed.

