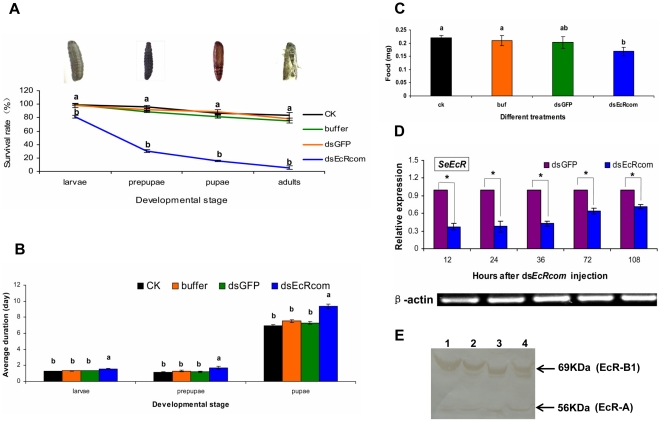
Figure 3. The survival rates, developmental duration, food-intake and the changes of SeEcR mRNA and protein in S. exigua after SeEcR RNAi.
(A) The accumulated percentage of survival rates, (B) Developmental duration, (C) Food intake, (D) The relative expression level of SeEcR and (E) The SeEcR protein level of S.exigua larvae in different treatments. For (A, B, C), the following three controls were included: an equivalent amount of GFP dsRNA, the same volume of buffer group (DEPC water) and the CK control group (no treatment). Data are presented as mean ± SE from three independent experiments with 30 fifth-instar larvae in each group. The lowercase letter “a” at each developmental stage in Fig. 3A represents no significant difference among dsGFP, buffer and CK groups but the survival rates in all three control groups are significantly different from that in the dsEcRcom-injection group (labeled with a lowercase “b” at the same developmental stage). Different letters at the same developmental stage in Fig. 3B and Fig. 3C among different treatments indicate significant differences of either developmental duration or food-intake (p<0.05, Duncan multiple comparison test, SPSS). For (D), the expression level of SeEcR and Seβ-actin transcripts were detected using qRT-PCR. By definition, the mRNA level of the target gene was normalized to Seβ-actin in each group; and the relative expression level of the target gene was measured as the level in the dsEcRcom-injection group divided by the level in the dsGFP-injection group. Data are shown as mean ± SE from three independent experiments. An asterisk indicates significant differences in the expression level between the treated and control groups measured at the same time (p<0.05, T test). For (E), the protein levels of target genes were detected using Western blot. A total of 80 ug of proteins from each individual treated with dsGFP or dsEcRcom was applied to each lane and separated by 10% SDS-polyacrylamide gel electrophoresis. Lanes 1 and 3: 36 and 12 hours post-dsGFP injection; Lanes 2 and 4: 36 and 12 hours post- dsEcRcom injection, respectively. The results are representative of four replicates.

