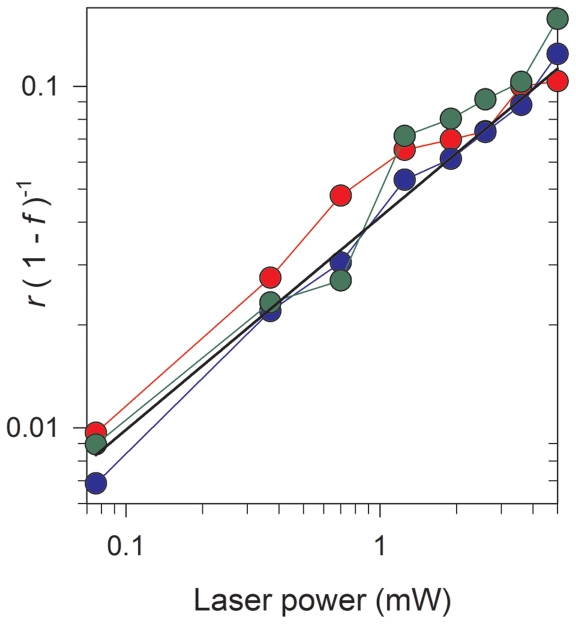
Figure 5. Plot of the rebinding to fluorescence-loss ration [r/(1−f)] as a function of laser power for a single line scan.
Data is shown for peptides CKII(290–312) (grey symbols), CKII(292–312) (green symbols), CKII(293–312) (blue symbols), and CKII(294–312) (red symbols); The plot shows that the rebinding fraction is not directly proportional to the loss of fluorescence, but is suppressed at lower laser powers. The solid black line is a least-square fitted power-law to the CKII(293–312) peptide data (blue symbols) and given by: r/(1–f) = 0.04 P 0.6, where P is the laser power.

