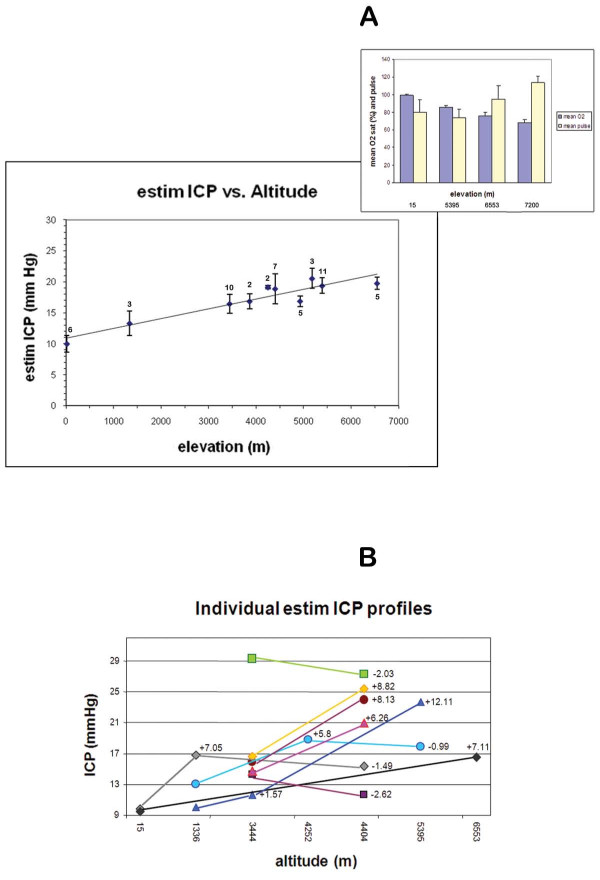
Figure 3.
Predicted ICP generally increases with elevation. A. A total of 42 normal adult volunteer subjects were administered from 1 to 3 ODM measurements at varying elevations for a total of 54 encounters. Altitudes ranged from sea level (15 m) to upper basecamp on the Everest trek (5400 m) and upper Camp 2 (6600 m) on the mountain. From these measurements, the resting tonometry results of Figure 3. and published nomogram [18], the estimated ICP was calculated (mm Hg). Each point represents the mean of 3-5 readings from a given encounter, averaged again over the number of individuals (n) measured at the elevations shown below. Bars are ± 1 SE. By linear regression, r = 0.88. Mean ICP at sea level was 10.0 ± 3.4 (SD, n = 6), at Namche Bazaar (3445 m) was 16.5 ± 4.7 (n = 10, p < .005), at basecamp was 19.3 ± 4.1 (n = 11, p < .001) and at Camp 2 was 19.8 ± 2.1 (n = 5, p < .001). Resting oxygen saturations and pulse (± SD) were obtained at sea level (15 m, n = 6), r=0.87; basecamp (5400 m, n = 7), Camp 2 (6553 m, n = 7) and Camp 3 (7200 m, n = 5) indicating progressive hypoxia. B. Individual variations in mean calculated ICP are plotted where the same subject underwent repeat measurement at a higher elevation. N = 9 subjects for a total of 12 interval changes. The interval difference is denoted with + (increase) or - (decrease).

