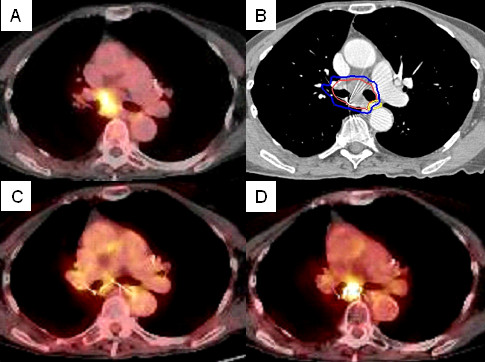
Figure 4.

Right hilar tumor treatment planning PET/CT with a tumor SUVmax of 7.0 (A), planned radiation dose distribution (B: the planning treatment volume is shown in red and the 30 Gy isodose line in blue), and PET/CT at 6, and 12 months post-treatment (C and D) show an initial decrease in SUVmax to 2.5 followed by local recurrence (SUVmax = 7.2).
