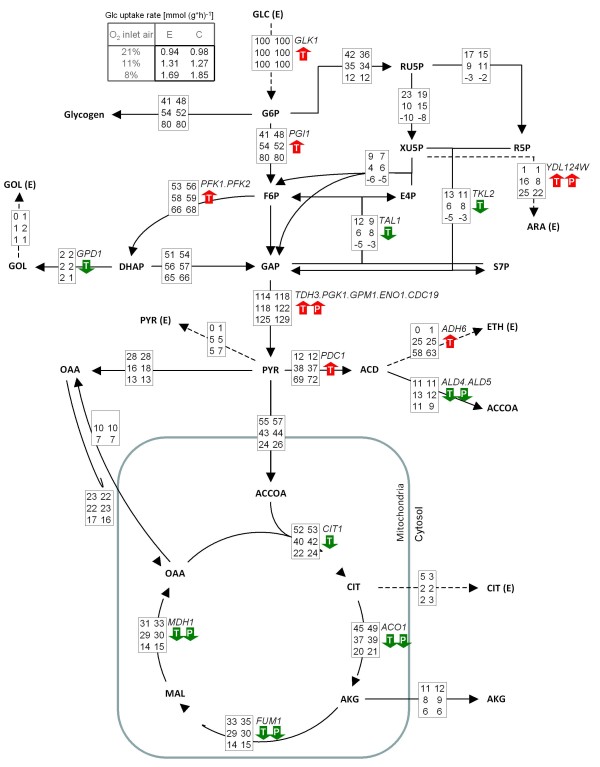
Figure 4.
Metabolic flux distributions in P. pastoris Fab-expressing and control strains under different oxygenation conditions. Relative net flux distributions of P. pastoris X-33/pGAPαA_Fab and X-33/pGAPαA in glucose-limited chemostats at a D = 0.1 h-1 under different oxygenation conditions. Fluxes are shown as relative fluxes normalized to the specific glucose uptake rate (expressed as mmol glucose g-1 DCW h-1) in the corresponding experiment. The specific glucose uptake rates corresponding to the different oxygenation conditions and strains are given at the top of the figure. The fluxes for each reaction in the network corresponding to 21%, 11% and 8% oxygen in the bioreactor inlet gas are given from top to bottom; the flux values from the Fab-producing strain are shown on the left and those from the corresponding control strain on the right. The transport of Oaa across the mitochondrial membrane under normoxic conditions is given as a single net influx value. Fluxes with SD values are provided in the Additional file 5. Arrows indicate higher (red) or lower (green) mRNA levels (T) and protein abundances (P) during hypoxia compared to normoxia. The corresponding gene/protein names (in italics) are displayed above the arrows, while all metabolite names are indicated in bold letters: GLC = glucose; G6P = glucose-6-phosphate; F6P = fructose-6-phosphate; GAP = glyceraldehyde-3-phosphate; DHAP = dihydroxyacetone phosphate; GOL = glycerol; RU5P = ribulose-5-phosphate, XU5P = xylulose-5-phosphate; R5P = ribose-5-phosphate; ARA = arabitol; S7P = sedoheptulose-7-phosphate; PYR = pyruvate; ACD = acetaldehyde; ETH = ethanol; ACOOA = acetyl CoA; OAA = oxaloacetate; CIT = citrate; AKG = alpha-ketoglutarate; MAL = malate; (E) = external

