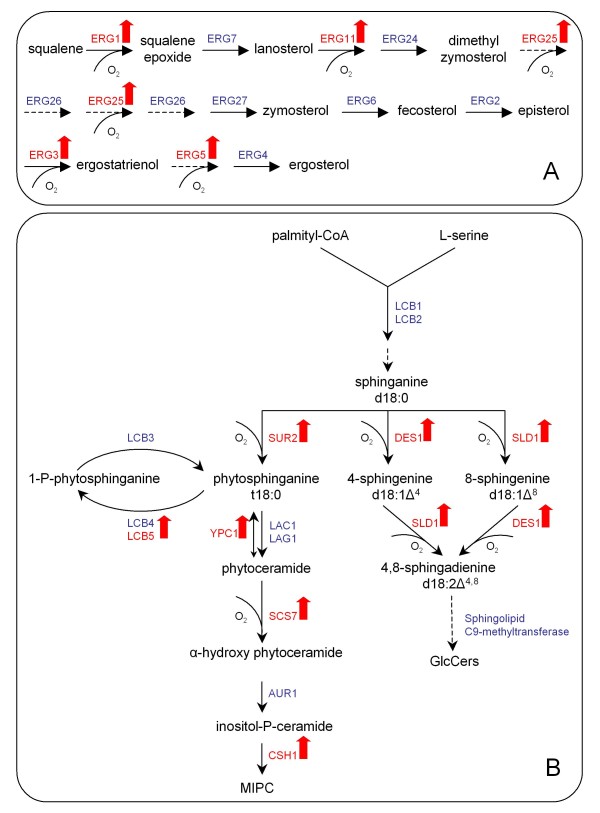
Figure 6.
Scheme of pathways involved in lipid metabolism. Schematic overview of the discussed pathways involved in lipid metabolism. Colour code: red = upregulated genes; green = downregulated genes; and blue = un-regulated genes under hypoxic conditions (log2 fold change ≥ 0.59 and p ≤ 0.05) A: Sphingolipid metabolism in the yeast P. pastoris adapted from [51]. MIPC = mannosyl-inositol-phosphorylceramide, GlcCer = glucosylceramides B: Outline of the post-squalene ergosterol biosynthetic pathway, dashed arrows indicate no specification of intermediates

