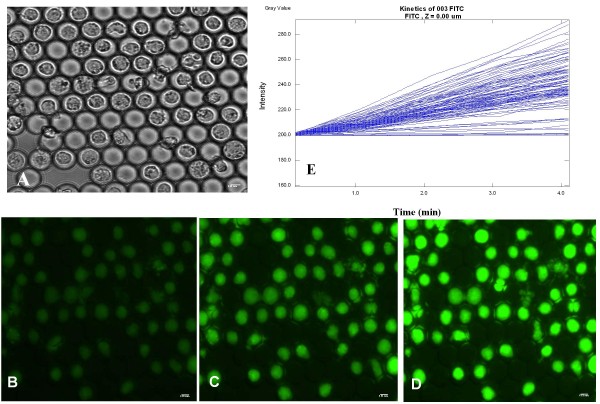
Figure 6.
Metabolic characteristics of U937 cells that underwent a freezing and thawing cycle in the i3C. At 3 hours after thawing the cells were stained by FDA (1.2 μM) and the kinetics of FI increase were measured. Transmitted light image (A) and the corresponding fluorescence images (B-D) of U937 cells at 1 minute (B), 3 minutes (C) and 5 minutes (D) after FDA addition. Scale bar: 0.01 mm. (E) Intracellular staining rates derived from image analysis of the same U937 cells as in A-D. Each line represents the FI vs. time for an individual cell.

