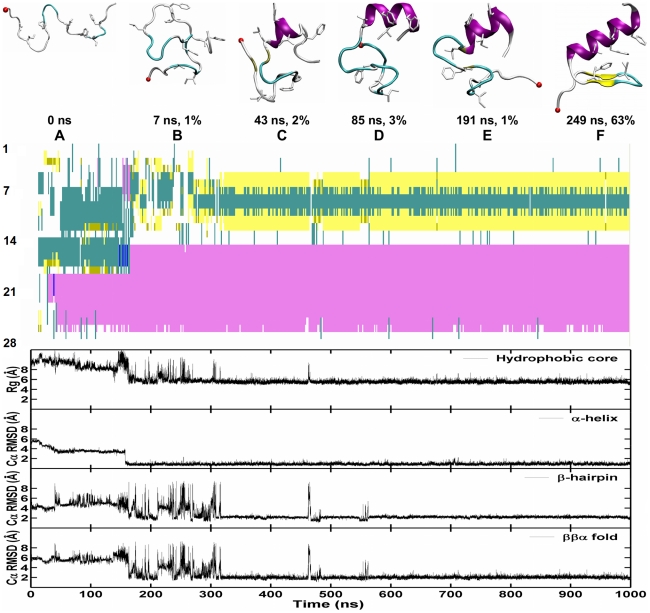
Figure 7. Successful folding trajectory 2 from CMD simulations of FSD-1 at 300 K.
Top: The representative snapshot of top structural families is presented together with its abundance and time. The backbone is shown in cartoon. The secondary structure is coded by color: coil in silver, α-helix in purple, β-sheet in yellow, isolated β-bridge in tan and turn in cyan. N-terminal is shown by a red VDW ball. Middle: The development of secondary structure. Bottom: The development of four order parameters: the radius of gyration of the hydrophobic core, the Cα-RMSD of the N-terminal hairpin (residues 3–13), the C-terminal α-helix (14–26) and the whole protein (residues 3–26) against the NMR structure.

