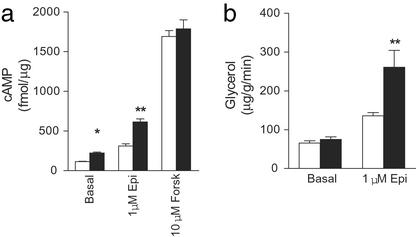
Figure 3.
Epinephrine-stimulated cAMP production in liver membranes and lipolysis in epididymal fat pads isolated from Gcgr+/+ and Gcgr−/− mice. (a) Epinephrine (Epi)- and forskolin (Forsk)-stimulated cAMP production in Gcgr+/+ (open bars) and Gcgr−/− (filled bars) mice. (b) Epinephrine-stimulated lipolysis as assessed by glycerol release. Data are representative of three experiments using three different membrane preparations. All data are the means ± SEM. *, P < 0.05; **, P < 0.01; ***, P < 0.001.

