Figure 3.

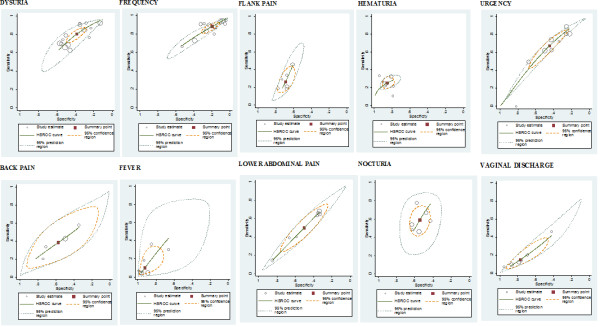
Receiver operating characteristic graphs with 95%-confidence region and 95%- prediction region for each sign and symptom (102).

Receiver operating characteristic graphs with 95%-confidence region and 95%- prediction region for each sign and symptom (102).