
Figure 4.
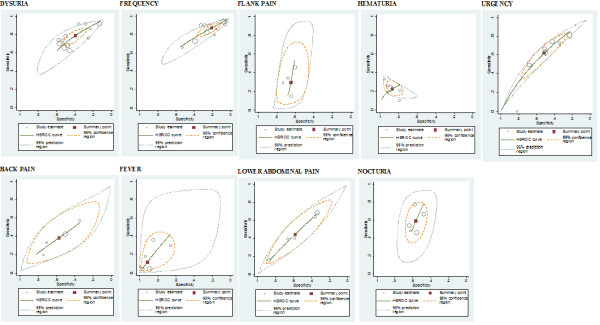
Receiver operating characteristic graphs with 95%-confidence region and 95%- prediction region for each sign and symptom (103).
Official websites use .gov
A
.gov website belongs to an official
government organization in the United States.
Secure .gov websites use HTTPS
A lock (
) or https:// means you've safely
connected to the .gov website. Share sensitive
information only on official, secure websites.
Receiver operating characteristic graphs with 95%-confidence region and 95%- prediction region for each sign and symptom (103).