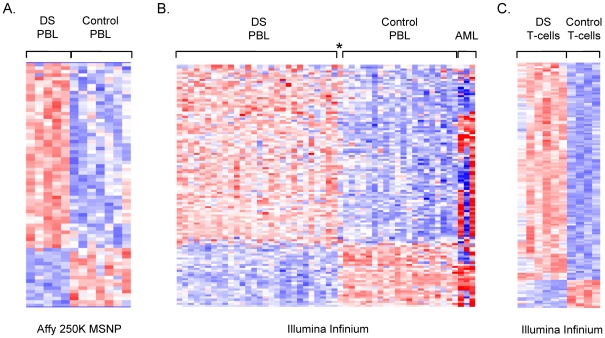
Figure 1. Microarray analysis of DNA methylation in DS versus normal PBL.
A, Supervised hierarchical clustering of the MI values from Affymetrix 250 K StyI MSNP. Applying ANOVA (p<.01) and a fold-change criterion (>1.2 fold change in MI in DS versus normal PBL) produced a set of 70 differentially methylated loci. The MI values for these loci were subjected to hierarchical clustering in dChip. Biological samples are on the x-axis and SNPs are on the y-axis with strong methylation indicated by the red color and weak or absent methylation by the blue color. B, Supervised hierarchical clustering of the Illumina Infinium data (fractional methylation) for 108 genes (118 probes) that passed ANOVA at p<.01, with additional criteria of >1.2 fold change and >0.1 absolute difference in DS versus normal PBL. The AML cases were not included in the statistical analyses but are shown here to highlight the fact that the perturbations in methylation in DS versus normal PBL are different and smaller in magnitude (less intense red and blue color) than in normal PBL versus AML. The asterisk indicates the single case of mosaic DS, which shows a pattern of methylation intermediate between DS and controls. C, Supervised hierarchical clustering of the Illumina Infinium data (percent methylation) for 140 CpGs, located in 134 different genes that passed ANOVA at p<.01 and the fold-change criterion (>1.3 fold change and >.15 absolute difference) in fractional methylation in DS T-cells versus normal T-cells. Genes mapping to the X or Y chromosomes were removed from each dataset (see Materials and Methods).

