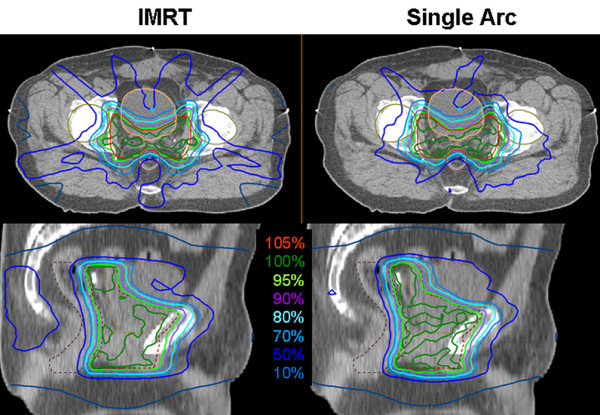
Figure 1.

Dose distributions for prostate cancer. Comparison of dose distributions achieved with 7-field IMRT (left) and Single Arc VMAT (right) on representative transversal (top) and sagittal (bottom) CT slices. The PTV is drawn in red, the bladder in orange, the rectum in maroon, and the femoral heads in green. Isodose lines are shown in percent of the prescription dose, i.e. 60 Gy to the average of the PTV.
