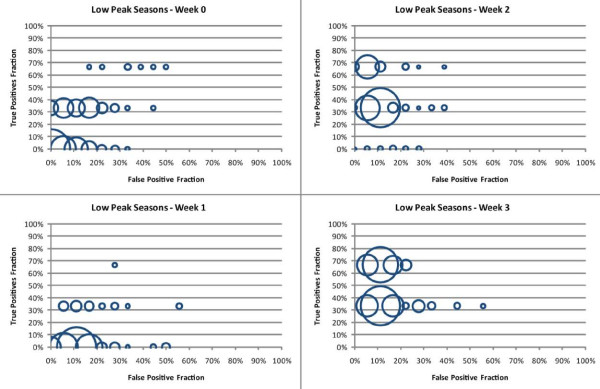
Figure 5.
The true positive fraction (y-axis) is graphed against false positive fraction (x-axis) for NB classifier models for low peak seasons and for every possible variable combination (n = 255) of the weather variables used in this study. The size of each circle represents the number of NB classifier models that obtained the given accuracy. Each model predicts an RSV outbreak the Sunday preceding the outbreak (Week 0), one week in advance (Week 1), two weeks in advance (Week 2), and three weeks in advance (Week 3).

