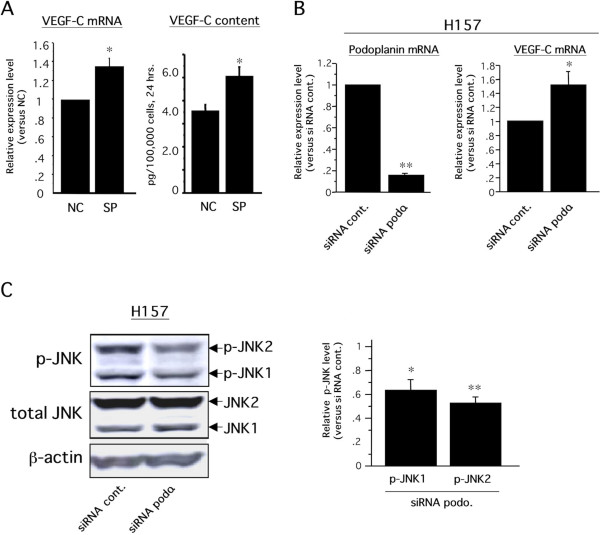
Figure 7.
Podoplanin-JNK-VEGF-C axis in H157 cells. A) Experiments similar to those described in Figure 6A were performed using H157. VEGF-C mRNA level (left graph) and VEGF-C content (right graph) in the culture media were assessed by real-time RT-PCR and ELISA, respectively, as described in Methods. For the ELISA, culture media were harvested twenty-four hours after treatment with inhibitor (n = 3 each, *p < 0.05). B) Similar experiments described in Figure 6C were performed using H157 (n = 3 each, *p < 0.05, **p < 0.0001). C) Similar experiments described in Figure 6D were performed using H157 cells. Each band intensity was measured as described in Methods, and the level of phosphorylated JNK1 (p-JNK1) or p-JNK2 was normalized with each total JNK level, and expressed as a relative fold increase compared to the control. (n = 3 each, *p < 0.05 versus siRNA cont., **p < 0.01 versus siRNA cont.).

