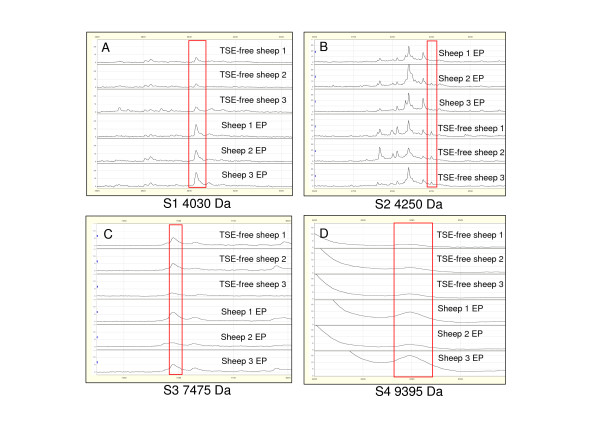
Figure 6.
Representative SELDI-TOF MS protein profiles of serum samples from three negative control TSE free sheep and three EP scrapie sheep. (A). Representation of the 4030 Da protein (S1) contained in F4. (B) Representation of the 4250 Da (S2) protein contained in F6. (C) Representation of the 7475 Da (S3) protein contained in F3. (D) Representation of the 9395 Da (S4) protein contained in F3.

