Figure 4.
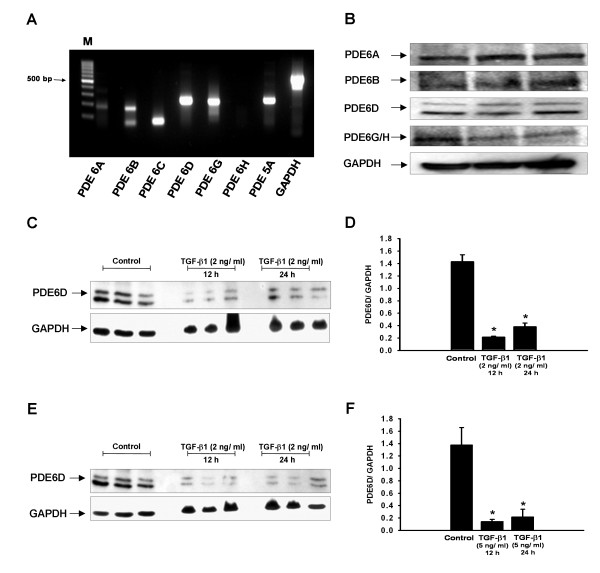
TGF-β1-induced PDE6D down-regulation in A549 AECs. (A) mRNA expression profile of PDE6 subunits in A549 AECs. (B) Protein expression profile of PDE6A (~105 kDa), PDE6B (~105 kDa), PDE6D (~17 kDa) and PDE6G/H (~11 kDa) subunits in A549 AECs. (C) TGF-β1 effects on PDE6D expression in A549 cells. A549 cells were rendered quiescence for 24 h in 0.1% FBS DMEM F12 medium, stimulated with TGF-β1 (2 ng/ml) for 12 and 24 h and PDE6D (~17 kDa) expression was measured by immunoblotting. GAPDH (~37 kDa) served as a loading control. (D) Corresponding densitometric analysis, normalized to GAPDH expression. Data were present as mean ± S.E, *P < 0.001 versus unstimulated cells. (E) TGF-β1 effects on PDE6D expression in A549 cells. A549 cells were rendered quiescence for 24 h in 0.1% FBS DMEM F12 medium, stimulated with TGF-β1 (5 ng/ml) for 12 and 24 h and PDE6D (~17 kDa) expression was measured by immunoblotting. GAPDH (~37 kDa) served as a loading control. (F) Corresponding densitometric analysis, normalized to GAPDH expression. Data were present as mean ± S.E, *P < 0.01 versus unstimulated cells.

