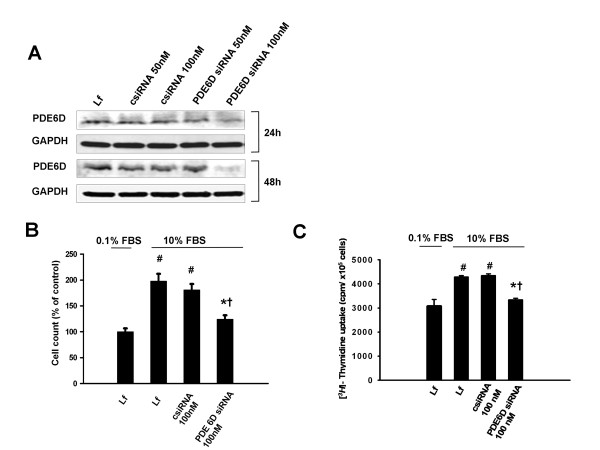
Figure 5.
Knockdown of endogenous PDE6D expression decelerates the proliferation rate of A549 AECs. (A) Demonstration of PDE6D knockdown in A549 cells: upper panel: decreased PDE6D (~17 kDa) immunoreactive protein 0-48 h post transfection with 100 nM PDE6D siRNA. The negative control siRNA (csiRNA, 100 nM) caused no change in PDE6D protein expression. The bottom panel represents GAPDH (~37 kDa) used as a loading control. (B) Bar graph presentation of cell counts from PDE6D siRNA transfected cells 24 h post serum stimulation. Data were expressed as % of control. Serum stimulation was significant #P < 0.001 versus 0.1% FBS stimulated cells. Cell number from PDE6D knockdown cells was significantly decreased as compared to csiRNA transfected and no siRNA transfected (only lipofectamine (Lf)) cells (*P < 0.001 versus csiRNA 100 nM transfected cells, †P <0.01 versus Lf treated cells). (C) Bar graph presentation of [3H]-Thymidine uptake in PDE6D knockdown cells 24 h post serum stimulation. Data were expressed as cpm/×105 cells. Serum stimulation was significant #P < 0.001 versus 0.1% FBS stimulated cells. [3H]-Thymidine uptake of PDE6D knockdown cells was significantly decreased as compared to csiRNA transfected and Lf treated cells (*P < 0.001 versus csiRNA 100 nM transfected cells, †P <0.001 versus Lf treated cells). Lf concentration was kept constant throughout the experimental settings and had no effect on cell viability (P = 0.2699).

