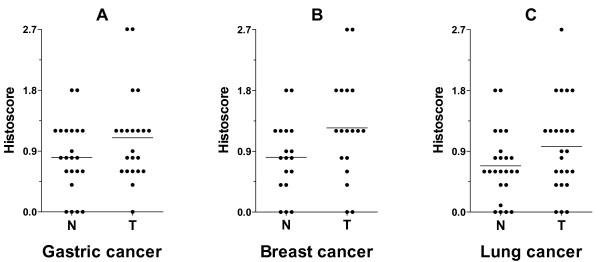
Figure 2.
The histoscore of VLDLR II staining in gastric (A), breast (B), lung (C) cancers and in the paired non-affected ones. Statistical analysis with histoscore (area stained multiplied by intensity) of VLDLR II in tissues from gastric, breast and lung cancer patients (22, 18, and 24, respectively). VLDLR II expression levels are significantly higher in tumors compared with normal tissues (P = 0.034, 0.018, and 0.043, respectively). Abbreviations: N, matched adjacent normal tissue; T, tumor tissue.

