Figure 2.
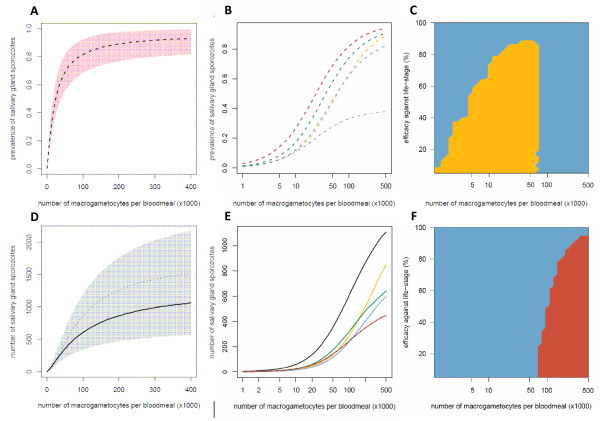
The impact of transmission-blocking interventions which target different parasite life-stages on the prevalence and density of salivary gland sporozoites. The Figure shows the relationship between the number of macrogametocytes ingested and the mean prevalence of infectious mosquitoes (dashed lines, A and B) or the mean number of salivary gland sporozoites per mosquito (solid lines, D and E). The model (described in Protocol S1) was run with either no intervention (black line) or representing an intervention which reduced the production of a Plasmodium life-stage by 60%: macrogametocytes (yellow line); ookinetes (blue line); oocysts (green line); salivary gland sporozoites (red line). The grey dotted-dashed line in panel B and panel E (where it lies on top of the red line) indicates an overall reduction in sporozoite density/prevalence of 60% as a benchmark for comparison. The shaded areas of panels A and D depict the 95% confidence intervals for the best-fit model. Panel D illustrates the importance of using an individual-based model (with which to account for parasite aggregation), as simply combining the three density-dependent functions within a mean-based, deterministic model (thin dotted-dashed line) underestimates the severity of the non-linear relationship. Panels C and F show which is the best life-stage to target to reduce transmission for a range of gametocyte densities and intervention efficacies: macrogametocytes (yellow surface); ookinetes (blue surface); sporozoites (red surface).

