Figure 3.
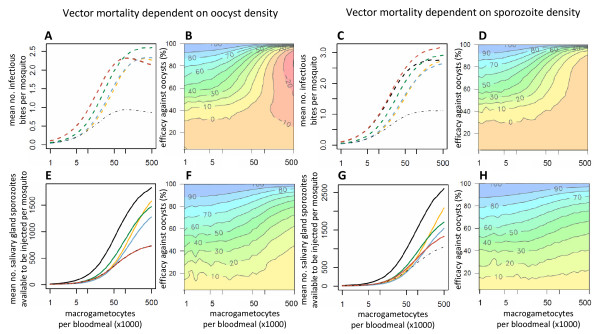
The impact on transmission of interventions which target different parasite life-stages. The Figure shows the relationship between the number of macrogametocytes ingested and transmission according to whether the latter is dependent on the presence (dashed lines, panels A, B, C and D) or density (solid lines, panels E, F, G and H) of salivary gland sporozoites. The mean number of infectious bites per mosquito and the lifetime mean number of salivary gland sporozoites available to be injected per mosquito are both estimated assuming the mosquito is infected at its first bloodmeal. Parasite-induced vector mortality is dependent on the number of oocysts at day 10 (A, B, E and F) or salivary gland sporozoites on day 21 (C, D, G and H). In panels A, C, E and G the model was run with either no intervention (black line) or representing an intervention which reduced the production of a life-stage by 60%: gametocytes (yellow line); ookinetes (blue line); oocysts (green line); salivary gland sporozoites (red line). Note that the black and red lines overrun each other in panel A. The thin grey dotted-dashed line indicates an overall efficacy of 60% for comparison. The contour plots (panels B, D, F and H) show the relationship between gametocytaemia, the efficacy of an intervention which targeting oocysts and the overall reduction in transmission that this intervention causes.

