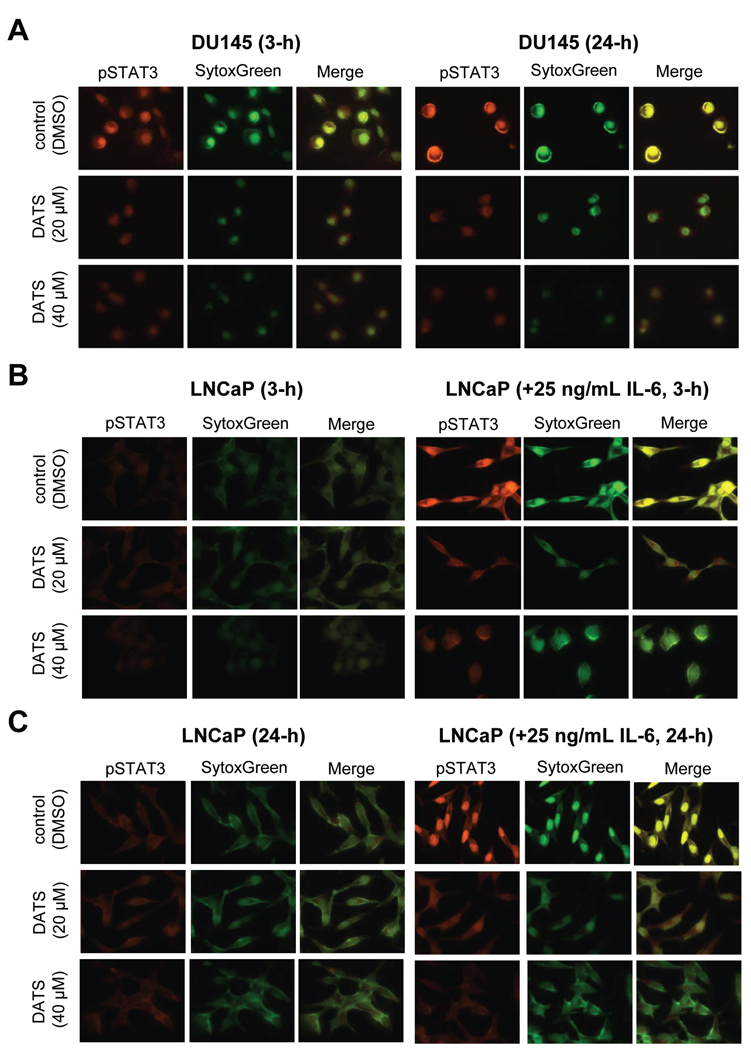
Fig. 2.
A, immunocytochemical analysis for pSTAT3 in DU145 cells following 3 or 24 hour treatment with DMSO (control) or DATS (20 or 40 µmol/L). B, immunocytochemical analysis for pSTAT3 in LNCaP cells following 3 hour treatment with DMSO (control) or DATS (20 or 40 µmol/L) in the absence or presence of 25 ng/mL IL-6. C, immunocytochemical analysis for pSTAT3 in LNCaP cells following 24 hour treatment with DMSO (control) or DATS (20 or 40 µmol/L) in the absence or presence of 25 ng/mL IL-6. Staining for pSTAT3 and nuclear DNA are indicated by red and green fluorescence, respectively (×100 objective magnification). Each experiment was repeated twice, and representative data from one such experiment are shown.

