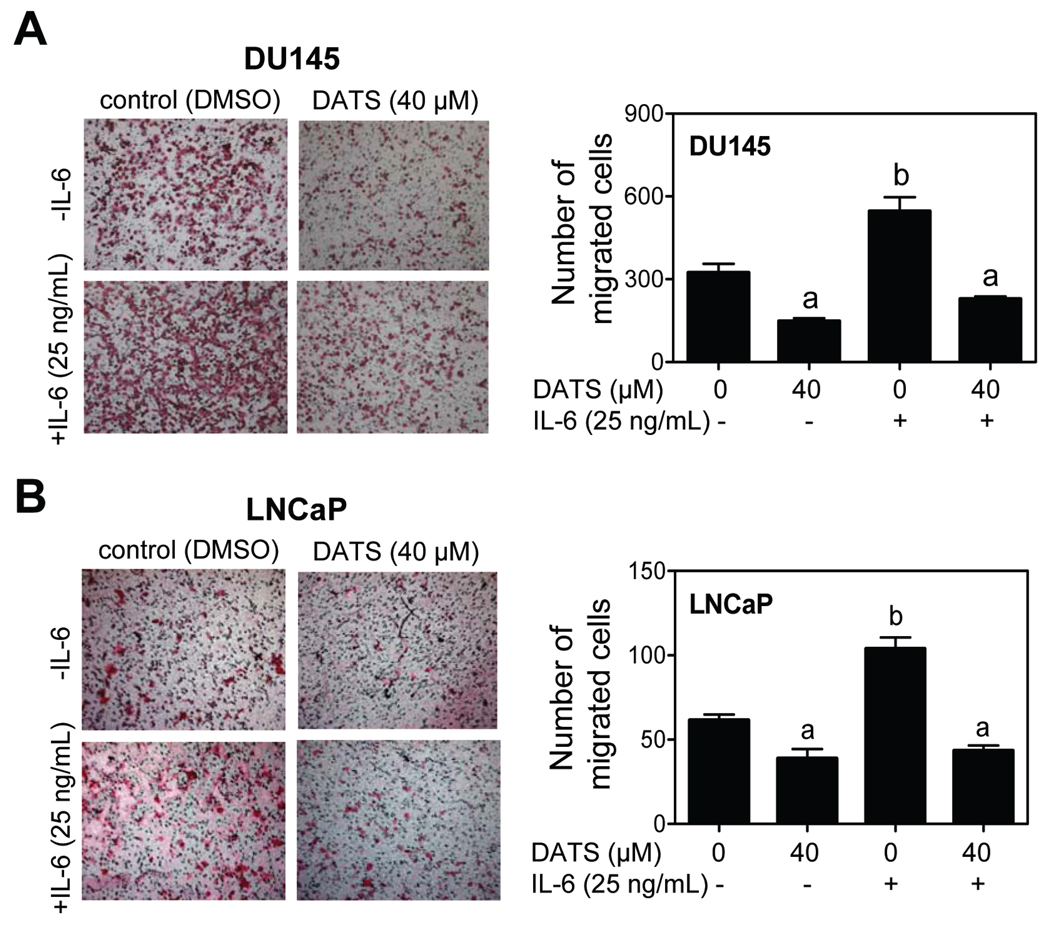
Fig. 5.
Representative images depicting in vitro migration by (A) DU145 cells and (B) LNCaP cells after 24 hour treatment with DMSO (control) or the indicated concentrations of DATS in the absence or presence of 25 ng/mL IL-6 (×10 objective magnification). Quantitative results are shown in right panels for each cell line. Columns, mean (n=8–10); bars, SD. Significantly different (P<0.05) compared with acorresponding DMSO-treated control, and bwithout IL-6 by one-way ANOVA followed by Bonferroni's multiple comparison test. Experiments were performed twice, and representative data from a single experiment are shown.

