
Figure 1.
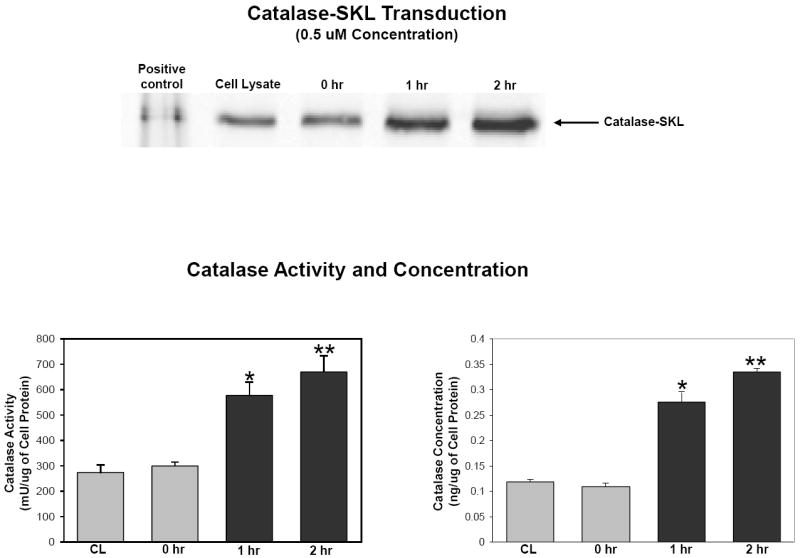
Effect of 0.5 uM catalase-SKL incubation for 2 hr on cellular catalase activity and concentration in cultured NRVM. Upper panel is a western blot of lysates of cells treated or not with 0.5 uM catalase-SKL for the times indicated. In the lane labeled positive control, pure catalase-SKL was loaded. Compared to control, myocytes incubated with catalase-SKL contained more catalase activity (lower left panel) and greater total amounts of the enzyme (lower right panel). CL = control cells. N=4 for all measurements. Significantly different from control; *p<0.05.