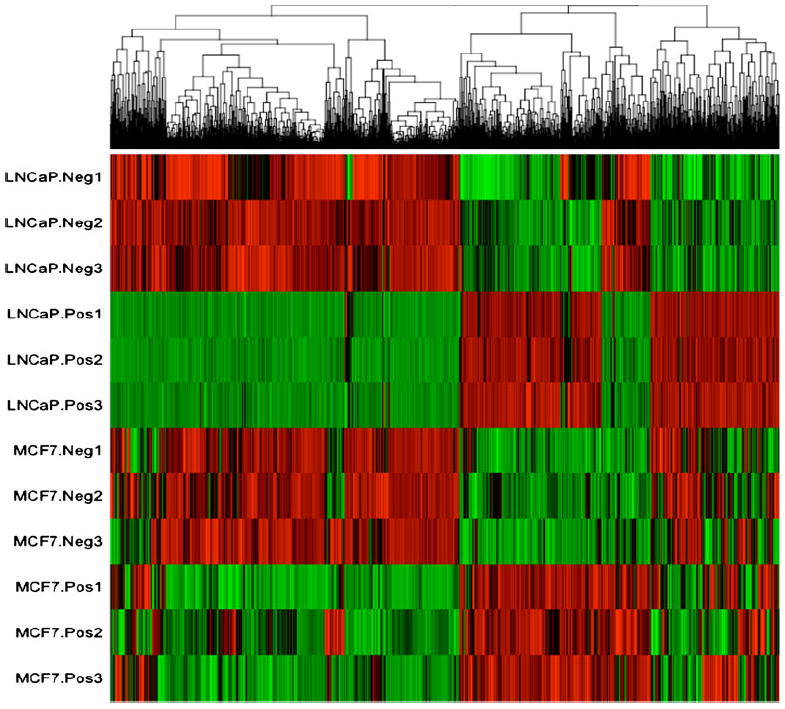
Fig. 1.

Heatmap showing the overall expression patterns of all genes differentially expressed in either LNCaP and MCF-7 cells, comparing methionine-treated (Pos) and untreated control (Neg) cells in three independent replicate experiments (1, 2, and 3). Each row represents one sample and each column one probe. The expression profile of each probe was first standardized (zero mean and one standard deviation). The red color represents higher than average, green color represents lower than average, and black means close to the average
