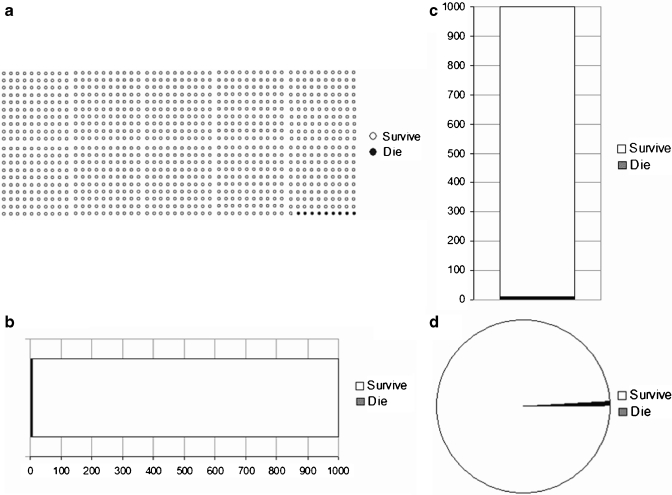
Figure 1.
(a) Icon array presented in Condition 1. (b) Horizontal bar graph presented in Condition 2. (c) Vertical bar graph presented in Condition 3. (d) Pie chart presented in Condition 4. All figures represented the number of people who died (i.e., 9) and survived (i.e., 991) from the surgery. Original material was in either German or English.

