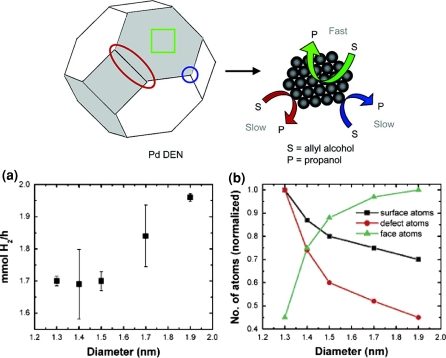
Fig. 59.
a Plot of the rate of hydrogen consumption as a function of particle diameter. b Plot of the total, calculated numbers of surface, defect, and face atoms for each particle size. The data are normalized to the largest number of each type of atom. Reprinted with permission from Wilson et al. (2006). Copyright: 2006 American Chemical Society

