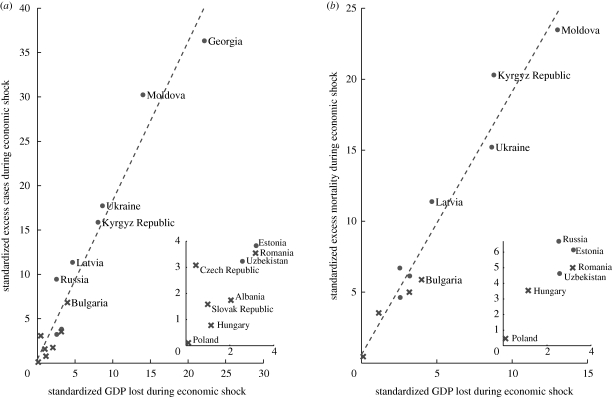
Figure 5.
GDP losses versus (a) excess TB r2 = 0.94347 and (b) mortality r2 = 0.94497, when standardized. Non-FSU countries are indicated with crosses. Inset shows a close-up of countries near the origin of the main plot. GDP loss and excess TB are calculated using a linear projection, as described in figure 3d.

