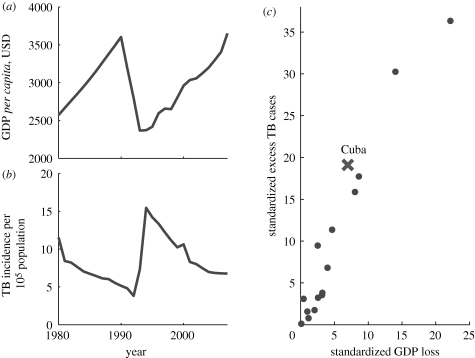
Figure 6.
A comparison of Cuba with CEE countries. Data for (a) GDP and (b) TB incidence during the collapse of the Soviet Union, exhibiting patterns qualitatively similar to CEE countries, are shown. (c) The placement of Cuba on the scatter plot of excess TB versus GDP loss. Re-evaluating correlation with the inclusion of Cuba, constrained at the origin, yields r2 = 0.92 and an estimated slope of 1.87 (95% CI 1.67, 2.08).

