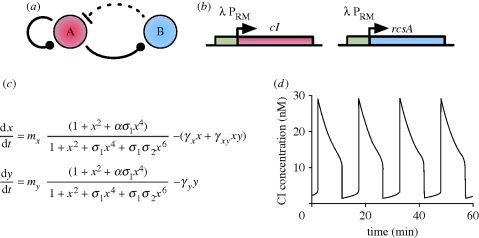
Figure 8.
(a) Variable link oscillator topology. At low concentrations of protein A, gene A promotes its own transcription and that of gene B, while at high A concentrations, A represses its own transcription and that of gene B. B is a protease and represses A by degradation. The variable links are denoted by a ball. Solid lines represent direct transcriptional control, while the dotted line represents the repression by proteolysis. (b) Possible in vivo implementation using the PRM promoter of the λ phage. Details provided in main text. (c) ODE model equations. x and y are dimensionless quantities of cI and RcsA, respectively, t is dimensionless time (see Hasty et al. (2001a) for details) and mi are the respective plasmid copy numbers. σi represents the relative affinities of cI dimer binding to OR1 relative to OR2 (σ1) and OR3 (σ3) binding. α is the degree to which transcription is enhanced by dimer occupation of OR2, while γx and γy capture degradation of cI and RcsA, respectively, and γxy represents the rate of cI degradation by RcsA. (d) In silico simulation of ODEs demonstrates oscillations. Figure (d) adapted from Hasty et al. (2001a).

