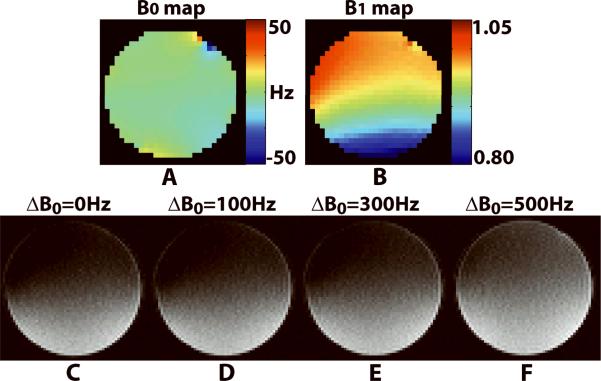
Figure 2.
Comparison of the standard B0 and B1+ maps and the RF transmitter calibration images of the phantom acquired with nominal 90° at on-resonance and 100-, 300-, and 500-Hz off-resonance. Standard B0 map (A) and B1+ map (B) acquired in an axial plane at magnet isocenter. Image-guided RF calibration images at on-resonance (C) and 100-, 300-, and 500-Hz off-resonance (D–F) are shown. The image-guided RF calibration sequence is relatively insensitive to off-resonance up to 300 Hz. Note that the dark regions correspond to locations where the RF excitation is approximately 90°.

