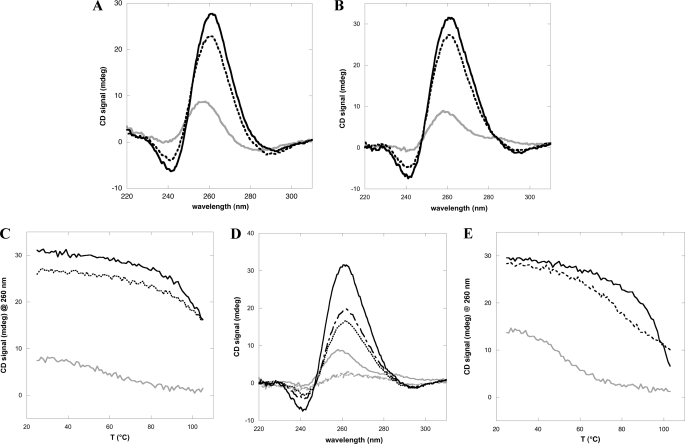
FIGURE 4.
G10-loop adopts a G-quadruplex fold in vitro. A, CD spectra of the c-MYC oligo annealed in the absence (gray continuous line) or presence of 100 mm NaCl (dashed line) or 100 mm KCl (black continuous line), respectively. A red shift of the peak at 260 nm and the formation of a through at 240 nm is observed. B, CD spectra of the G10-loop oligo. The same features observed with c-MYC oligo are observed. The line format is the same as in A. C, thermal denaturation profiles of G10-loop in the 25–105 °C interval and in the absence (gray continuous line) or presence of 100 mm NaCl (dashed line) or 100 mm KCl (black continuous line). D, CD spectra of the G10-loop in the absence (gray continuous, gray dashed dotted, and gray dotted at 25, 95, and 105 °C, respectively) or presence of 100 mm KCl (black continuous, black dashed dotted, and black dotted at 25, 95, and 105 °C, respectively). Spectra at 95 and 105 °C in the absence of salts are the same, whereas in the presence of 100 mm KCl, they are different, indicating that the melting transition is not yet complete in the latter case. E, thermal denaturation profiles of c-MYC oligo in the 25–105 °C interval, collected in the absence (gray continuous line) or presence of 100 mm NaCl (dashed line) or 100 mm KCl (black continuous line).

