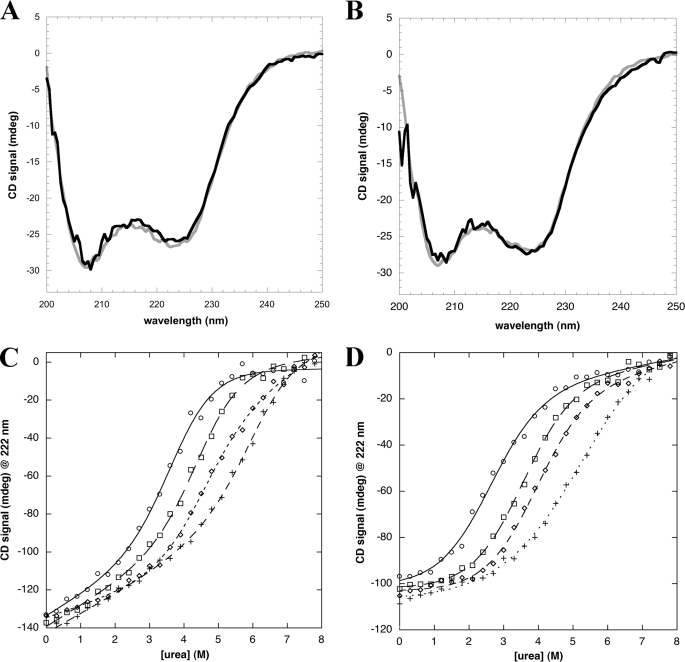
FIGURE 7.
Folding analysis of the region differentiating NPM1-C70 from NPM1-C53 (amino acids 225 to 241). A, the CD spectra of NPM1-C70 (20 μm) in the absence (gray line) or presence of c-MYC oligo (20 μm; black line) are almost identical. B, CD spectra of NPM1-C70 (20 μm) in the absence (gray line) or presence of G10-loop oligo (20 μm; black line). C, urea-induced denaturation of NPM1-C70 in the absence (open circles) or presence of 250 mm (open squares), 500 mm (open diamonds), and 1.0 m (crosses) NaCl are reported. Data were fitted according to a two-state model (lines) and folding parameters are reported in Table 4. D, urea-induced denaturation of NPM1-C53 under the same conditions as in panel C. Symbols are also the same.

