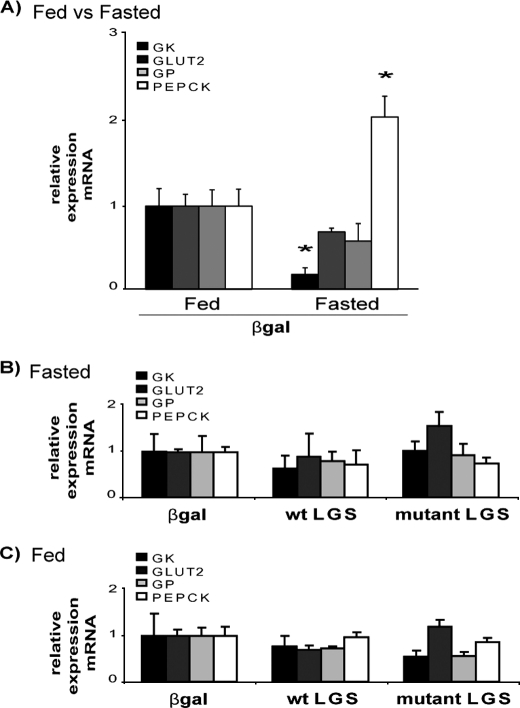
FIGURE 4.
Effects of the overexpression of WT LGS and activated mutant LGS on glucokinase, GLUT2, glycogen phosphorylase, and phosphoenolpyruvate carboxykinase expression levels in rat liver. A, RT-PCR analysis of liver GK, GLUT2, GP, and PEPCK mRNA levels in livers of fed and fasted rats overexpressing β-gal; data are relative to the fed β-gal group. B, RT-PCR analysis in fasted overexpressing β-gal, WT LGS, or mutant LGS rats; data are relative to the fasted β-gal group of rats. C, RT-PCR analysis in fed overexpressing β-gal, WT LGS, or mutant LGS rats; data are relative to the fed β-gal group of rats. In all cases, relative expression levels were calculated with the 2ΔΔCt method using 18 S rRNA as endogenous control, and data represent the mean ± S.E. (error bars) of the following: seven fasted and seven fed β-gal-overexpressing rats; five fasted and six fed WT LGS-overexpressing rats; and five fasted and five fed mutant LGS-overexpressing rats. In A the asterisk indicates significant difference, with p < 0.05.

