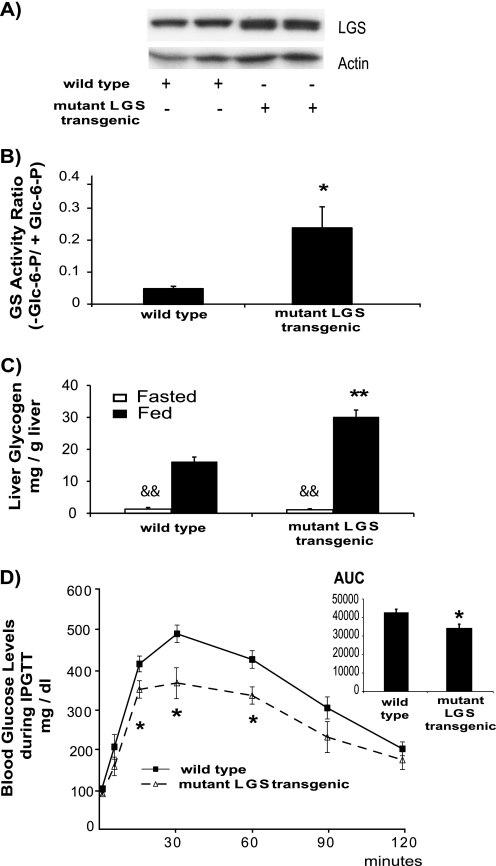
FIGURE 6.
Characterization of transgenic mice expressing activated mutant LGS in liver. A, representative Western blot analysis of liver extracts of wild type and activated mutant LGS transgenic mice (two samples of each) with antibodies against LGS or actin as a load control. In all cases, 20 μg of protein were analyzed per lane. B, GS activity ratio (−glucose 6-phosphate/+glucose 6-phosphate (−Glc-6-P/+Glc-6-P)) of liver homogenates from wild type (n = 8) and mutant LGS transgenic (n = 4) mice. Data represent the mean ± S.E. (error bars). C, liver glycogen content (mg/g of liver) measured in fasted (white bars) or fed (black bars) wild type and mutant LGS transgenic mice. Data represent the mean ± S.E. of six fasted and four fed wild type mice and five fasted and four fed mutant LGS transgenic mice. D, wild type (n = 9) and mutant LGS transgenic (n = 6) mice were fasted for 18 h before receiving an intraperitoneal glucose bolus of 2 g/kg body weight. Tail vein blood samples were taken, and glucose concentrations were measured at the times indicated after the glucose bolus. The area under the curve was measured for each experimental group (AUC, inset). Data represent the mean ± S.E. The single or double asterisks denote statistical difference for comparisons with WT group at the same metabolic state with p < 0.05 or p < 0.005, respectively. The double ampersand denotes statistical difference (p < 0.005) between the fasted and fed states for each group of mice.

