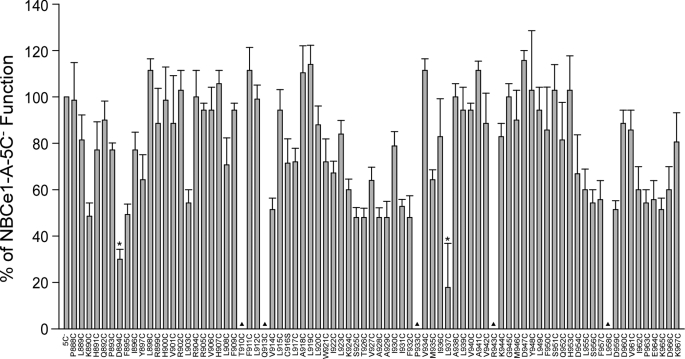
FIGURE 8.
Summary of the transport function of NBCe1-A cysteine-substituted constructs. Transport data were expressed as a percentage of NBCe1-A-5C− function. Triangles mark the uncharacterized constructs due to lack of plasma membrane expression. Asterisks mark the constructs with <30% transport activity of NBCe1-A-5C−. Error bars represent mean ± S.E. (n = 5–7).

