FIGURE 1.
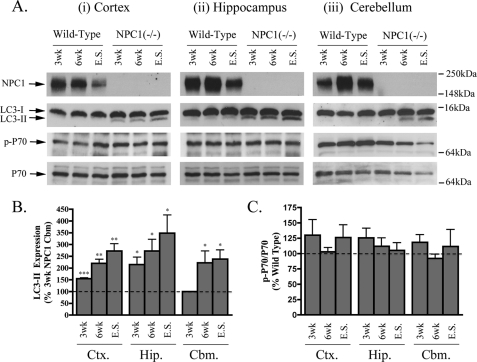
Progressive LC3-II accumulation in NPC1 mouse brains. A, representative immunoblots of NPC1, LC3-I/II, p-p70, and total p70 expression in cortical (Ctx, panel i), hippocampal (Hip., panel ii), and cerebellar (Cbm., panel iii) regions of wild type and NPC1 brains at 3 and 6 weeks and end stage (9–12 weeks). B, histogram of LC3-II expression in NPC1 brain regions relative to 3-week NPC1 cerebellar levels (n = 5, mean ± S.E.). Note: comparisons with corresponding wild type mice was not possible due to undetectable basal levels of LC3-II in healthy mice. Considering 3-week NPC1 regions had the lowest expression of LC3-II among the NPC1 mice, their levels were used as a base line for comparing LC3-II changes in other NPC1 brain regions. C, histogram of phospho-p70/total p70 expression in NPC1 brain relative to corresponding brain regions in age-matched wild type controls (n = 6, mean ± S.E.).

