FIGURE 2.
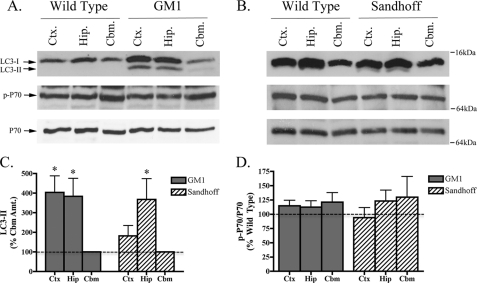
LC3-II is increased in GM1 gangliosidosis and Sandhoff disease mouse brains. Representative immunoblots of LC3-I/II, p-p70, and total p70 expression in the cortex (Ctx.), hippocampus (Hip.), and cerebellum (Cbm.) of GM1 gangliosidosis (A) and Sandhoff disease (B) mouse model brains at end stage. C, histogram depicting LC3-II expression as a percentage of cerebellar LC3-II levels in GM1 gangliosidosis and Sandhoff mouse brain regions. D, histogram of phospho-p70/total p70 expression in GM1 gangliosidosis and Sandhoff brains relative to age-matched wild type controls (n = 5 for GM1 mice, n = 5 for Sandhoff mice, mean ± S.E.).

