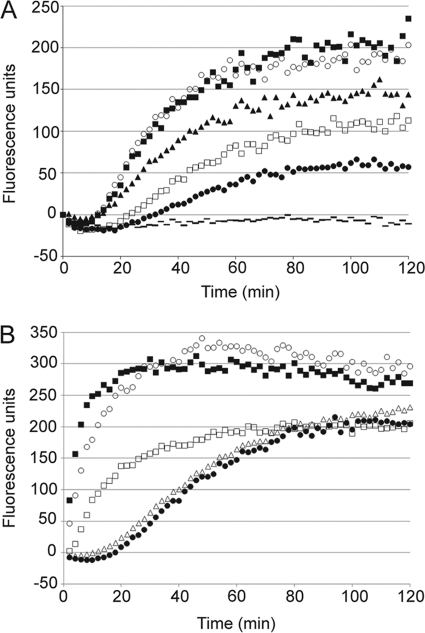
FIGURE 2.
Kinetics of hyphal membrane permeabilization. Permeabilization of F. oxysporum f. sp. vasinfectum hyphae induced by varying concentrations of NaD1 (40 μm (○), 20 μm (■), 10 μm (▴), 5 μm (□), 2.5 μm (●), and no NaD1 ( )) (A) or a range of antifungal peptides (B) was monitored using a SYTOX Green uptake assay. A, after a lag time of 15 min, NaD1 caused a concentration-dependent increase in SYTOX Green uptake up to 80 min. At concentrations over 20 μm, there was no increase in the rate of permeabilization. B, at 5 μm, CP-29 (■) and BMAP-28 (○) caused rapid SYTOX Green uptake with maximum fluorescence reached within 20 min. LL-37 (□) was slightly slower, taking 40 min to reach the maximum. NaD1 (●) and Bac2A (△) had very similar kinetics, with a slight lag prior to induction of SYTOX Green uptake, followed by a linear increase in fluorescence up to 80 min. Data are from a single experiment representative of three individual replicates.

