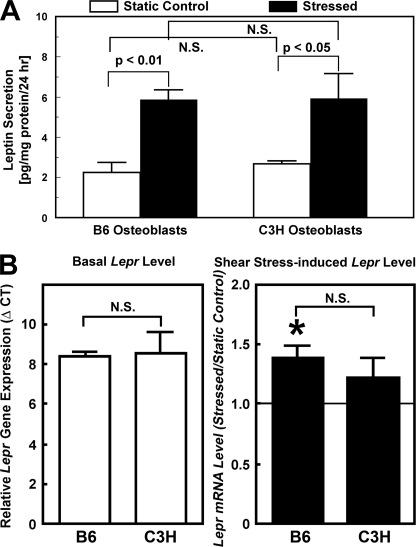
FIGURE 8.
Comparison of basal and shear stress-induced secretion levels of leptin into CM by B6 and C3H osteoblasts in vitro (A) and basal and shear stress-induced Lepr mRNA expression levels in B6 and C3H osteoblasts (B). In A, the 24-h CM of B6 (left) or C3H osteoblasts (right) with or without the 30-min fluid shear were concentrated 7-fold, and the amounts of leptin in each concentrated CM were assayed with the mouse leptin EIA kit (Assay Designs, Inc.) and normalized against cellular protein content. Results are shown as mean ± S.D. (error bars) (n = 4 each). In B, the relative Lepr mRNA expression levels were determined by real-time RT-PCR. Left, the mRNA levels were assessed by the ΔCT method, and basal Lepr mRNA expression was reported as ΔCT compared with β-actin. Right, cells were subjected to a 30-min steady shear stress of 20 dynes/cm2. The -fold change in Lepr mRNA levels in response to the shear stress was determined by ΔΔCT, and the results were shown as ratio of the stressed cells/static control cells (mean ± S.D., n = 3 each). *, p < 0.05, compared with static control cells. N.S., not significant.

