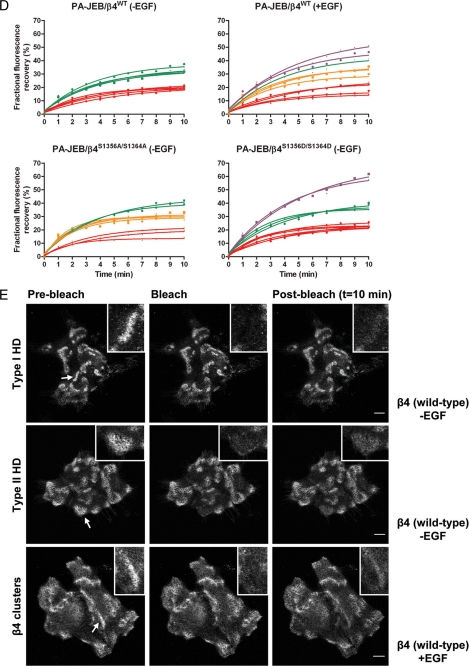
FIGURE 8.
Phosphorylation of Ser-1356 and Ser-1364 prevents the assembly of both type I and II HDs. A, PA-JEB/β4WT, PA-JEB/β4S1356A/S1364A, and PA-JEB/β4S1356D/S1364D were starved overnight in growth factor-free medium and the cells were immunolabeled with antibodies against β4 (red) and plectin (green). Co-localization is visualized in the overlay images (yellow). The scatter plots display the intensity of distribution and the degree of co-localization in the corresponding cells. In the right panels, high intensity co-localizing pixels are shown in yellow, non-colocalizing β4 pixels in red and non-colocalizing plectin pixels in green. B, PA-JEB/β4WT, PA-JEB/β4S1356A/S1364A, and PA-JEB/β4S1356D/S1364D were starved overnight, with or without EGF-stimulation for 1 h. The cells were immunolabeled with antibodies against β4 (red), plectin (green), and BP230 (blue) and their co-localization is visualized in the overlay image (white). C, percentage of type I HDs is determined by the ratio of co-localization of β4 and BP230 (type I HDs), and that of β4 and plectin (type I and II HDs). As a control, the ratio between β4 and BP230, and that of plectin and BP230 was determined, which should be 1. D, PA-JEB cells stably expressing EGFP-tagged wild-type or mutant β4 subunits were starved overnight in growth factor-free medium and left untreated or treated with EGF for 60 min. The graphs show the kinetics of recovery of fluorescence intensity over time in bleached regions containing HDs of the indicated cell lines. The fluorescence intensity in the bleached region is expressed as relative recovery. Each line represents data obtained from a different region of a cell. Note the slow, intermediate, and fast recovery of fluorescence in the different cell lines, which represents the mobility of β4 in type I (red), type II (green), mixed clusters of type I and II HDs (yellow), and β4 molecules that are not bound to plectin but are clustered by having bound to Ln-332 deposits (purple). E, representative images of PA-JEB/GFP- β4WT cells left untreated or treated with EGF are shown pre-bleach, immediately after bleach (t = 0), and post-bleach (t = 10 min).


