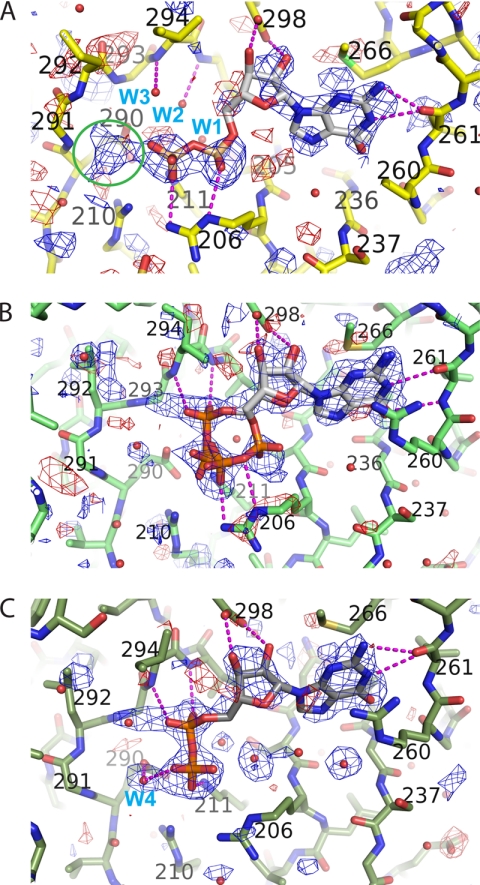
FIGURE 4.
Different modes of nucleotide binding in the active site of PimB′. A, σA-weighted Fo − Fc density map (contour levels 2.2 σ (blue) and −2.2 σ (red)) of triclinic PimB′. The green circle marks the position of the density blob corresponding to the GDP-linked mannose. B and C, σA-weighted Fo − Fc density maps (+2.8 σ (blue), −2.8 σ (red)) of GDP-Man (B) and GDP-bound (C) complexes of orthorhombic PimB′. Selected water molecules are labeled in blue, and dashed lines in magenta indicate a subset of relevant non-covalent interactions. All maps were calculated with Fc amplitudes and phases of the ligand-free model.

