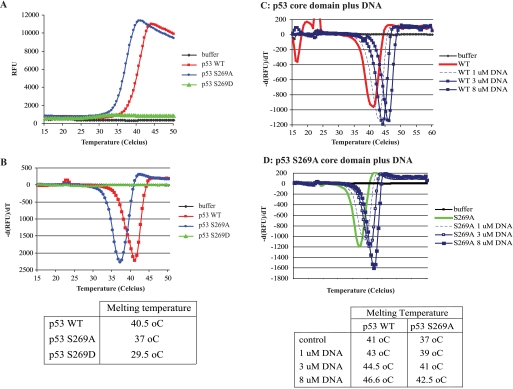
FIGURE 6.
Thermal stability of p53 serine 269 substitution mutants. A, thermal melting profile of p53 mutants. Unfolding of p53 mutants was monitored between 15 and 50 °C using SYPRO Orange fluorescent dye, and melt curves were generated by plotting SYPRO Orange fluorescence as a function of temperature in relative fluorescent units (RFU). B, phase transitions in the thermal melting profile. The gradient of p53 unfolding was plotted as a function of temperature to obtain the midpoint temperature transition (Tm) for each variant. C and D, effect of ligands on p53 unfolding. Unfolding of p53 wild type (C) and p53S269A (D) was measured between 15 and 60 °C in the presence of increasing concentrations of p21 consensus DNA. The midpoint unfolding transition temperatures are indicated below. Thermal analyses were performed in triplicate; however, a single trace representative of each mutant is shown.

