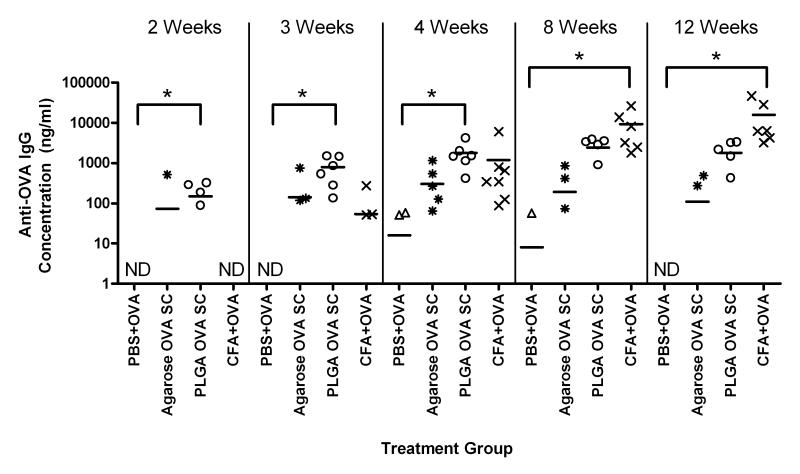
Figure 4.
Production of anti-OVA IgG antibodies by C57BL/6 mice treated with OVA co-delivered with PBS (PBS+OVA), agarose SC (Agarose OVA SC), PLGA SC (PLGA OVA SC) or CFA (CFA+OVA). Total IgG concentrations were measured by ELISA from sera collected at different times. No detectable anti-OVA antibodies were produced from mice receiving SC without OVA. Data are shown as replicates with means represented as a line (n=5-7 mice). * indicates significant difference between treatment group and negative control. ND indicates none of the collected sera samples contained detectable amount of antibody.

