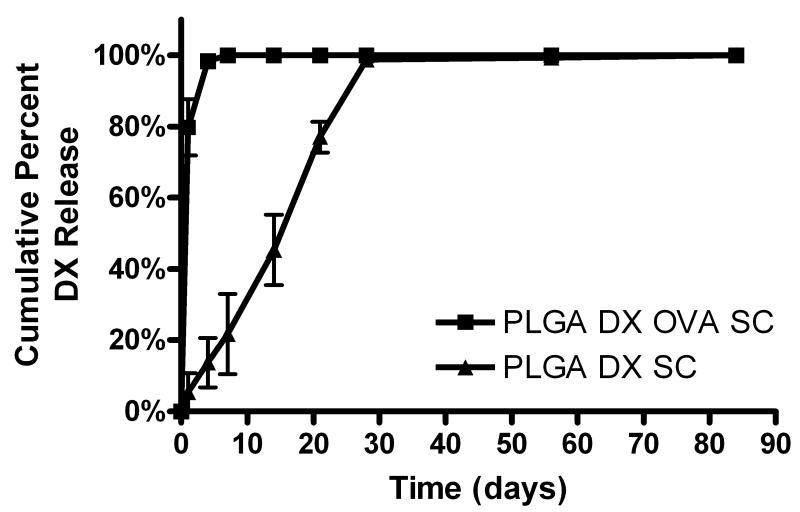
Figure 6.
Cumulative DX release from PLGA SC with (PLGA DX OVA SC) and without (PLGA DX SC) incorporated OVA over 84 days (n=3 SCs). Each SC was placed in 4 ml of PBS at pH 7.4 and rotated at 37°C. At each time point, saline samples were collected and replaced with fresh PBS of the same volume. Data are shown as percentage of the total DX release for SC (mean ± SD).

